Example: Use a graph in a math question
Updated 28 Aug 2023
This example creates a simple linear graph and asks students to identify the coordinates of the intercepts. The graph incorporates algorithmic values.
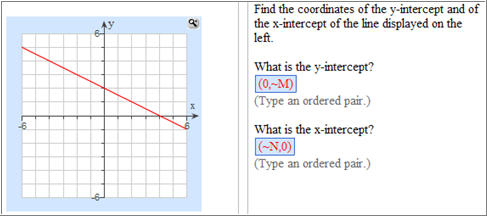
Your question looks like this:
You have already defined your algorithmic values as shown in this Algorithmic Values List:

To create your graph question:
- When you open the Create Custom Question wizard, choose to start with an empty template.
- Select Left/Right as the format and click Next.
- Delete the placeholder text in the problem statement area on the left and click Graph in the left menu.
The Edit Graph window opens.
- On the Graph tab, choose Large as the graph size and keep all other default settings. Click Next.
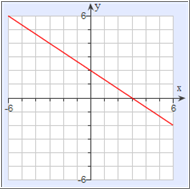
- On the X-Axis and Y-Axis tabs, make the following settings to create a 6 by 6 grid:
- Minimum: Enter
-6. - Maximum: Enter
6. - Select Label Minimum and Maximum to label only the minimum and maximum values.
- Minimum: Enter
- On the Plots tab, click Add > Linear to graph a linear equation.
The formula for your graph displays in the table.
- Enter the values for the formula in the boxes below the table:

- To make the line red, click on the Color box and select red from the left column (code ff0000).
- On the Alt Text tab page, enter a brief description of the graph for students using screen readers.
- The preview of your graph looks something like this:
- Click Save to add your graph to the question.
- In the interaction area on the right, delete the placeholder text and enter:
Find the coordinates of the y-intercept and of the x-intercept of the line displayed on the left. - On a new line, enter:
What is the y-intercept? - Put your cursor on the next line and click Short Answer to create the answer.
- In the Edit Answer Definition window, do the following:
- Step 1: Select Specify a subset of equivalent answers to accept and Accept similar answer or algebraic function.
- Step 2: Click in the first row under Value and enter the coordinates:
(0,~M). Select The correct answer(s) are ordered pairs. - Step 3: Leave all settings as the defaults.
- Step 4: Enter the following incorrect answer feedback:
To locate the y-intercept of the line, find the coordinates of the point where the line intersects the y-axis. To locate the x-intercept of the line, find the coordinates of the point where the line intersects the x-axis. Be sure to type the coordinates as ordered pairs. - Click Save.
- On a new line, enter:
What is the x-intercept? - Put your cursor on the next line and click Short Answer to create the answer.
- In the Edit Answer Definition window, do the following:
- Step 1: Select Specify a subset of equivalent answer to accept and Accept similar answer or algebraic function.
- Step 2: Click into the first row under Value and enter the coordinates: (~N,0). Select The correct answer(s) are ordered pairs.
- Step 3: Leave all settings as the defaults.
- Step 4: Enter the following incorrect answer feedback:
To locate the x-intercept of the line, find the coordinates of the point where the line intersects the x-axis.- Click Save.
- Enter tips under each answer box to remind your students that the answers are ordered pairs:
- Under the first short answer box, enter:
(Type an ordered pair.)- Make the text gray by selecting the tip, clicking the text color icon (
 ), and choosing dark gray from the palette.
 - Highlight the tip, right-click on it, and select Copy from the menu.
- On a new line under the second answer, right-click and select Paste to copy the tip.
- Click Regenerate Values in the algorithmic values toolbar to make sure that your question works properly.
- Click Preview Exercise in the formatting toolbar to see how the question looks to your students.
- When you are satisfied with your question, dismiss the Preview window and click Save.