What question types are available?
Each of the 18 available question types is described below, with an image showing how class results are displayed for each type.
Question types
Click each question type to show or hide its description and image, or click ![]() above the side menu (if available) to expand or collapse all at once.
above the side menu (if available) to expand or collapse all at once.
|
Students sketch a graph using their mouse or by touching their screen. The results are displayed as a single composite sketch, with each student's individual sketch overlaid semi-transparently on top of each other. This type works well with large classes when you want to get an overall sense of the common themes among sketches. For smaller classes or when you want to view individual sketches in class, try the regular sketch type. |
|
|
Students distribute a fixed number of votes among the response choices. (For example, students might place all of their votes on a response choice they are very confident of, or might indicate uncertainty by spreading out their votes among several choices.) You may select one or more answers to be counted as correct. Indicate opinion questions by not marking any answers as correct. |
|
|
Respondents report a numeric data point, and the results are displayed as a histogram with descriptive statistics (mean, standard deviation, etc). Use this question type when students are reporting numeric data that is the result of an experiment. |
|
|
Students graphically draw an arrow/vector indicating a direction. Only the direction of their arrow counts towards the correctness of their answer. |
|
|
Students enter a mathematical expression like x^2(y+1) or sin(t)*cos(t) using a keyboard and, if enabled, the |
|
|
Students highlight one or more points in a passage, and the results are displayed as a heat map, where the most frequently highlighted parts of the passage are highlighted more brightly. |

|
|
Students upload an image from their computer, or use their iPhone or iPad to take a picture. The maximum image size of the GIF, JPG, or PNG image file is 5Mb. You can hover over an individual image to see it magnified at a larger size. |
|
|
Students enter free text in a large input box. |

|
|
Students select zero, one, or many choices. You may select one or more answers to be counted as correct. Indicate opinion questions by not marking any answers as correct. |
|
|
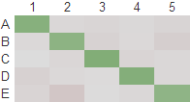
Students are presented with a set of subquestions and a set of options, and must select the appropriate option for each subquestion. |
|
|
Students select one choice. You may select one or more answers to be counted as correct. Indicate opinion questions by not marking any answers as correct. |

|
|
Respondents enter a numerical value. You may optionally set a tolerance to accept a range of responses as correct (e.g., the correct answer may be 4.23, but you may wish to accept any value between 4.2 and 4.3 as correct). To indicate scientific notation, use an "E" or "e" to indicate the exponent (e.g., 4.2e6 means 4.2 x 10^6). |

|
|
Students prioritize the given choices, and the results are summarized by showing the relative strength of the preference of each choice. There is no correct answer. |
|
|
Students rank a list of items in order. Students may specify that several items on the list are equal. |
|
|
Students click or touch their screen to indicate one or more points on an image. You draw a region on the image that defines what answers should be considered correct. |
|
|
Students enter free text in a small input box. |
|
|
Students sketch a graph using their mouse or by touching their screen. The results are displayed as a tiled set of individual student sketches. This type works better for smaller classes or when you want to be able to look at individual student sketches during class. For larger classes, try the "composite sketch" type. |
|
|
Students enter free text in a small input box, and the results are displayed to the instructor in a word cloud. |
|
|
In any kind of session delivery, students are shown a static slide with text, graphics, or both. No response is requested from the students. Consider using single-slide "questions" in lieu of a short PowerPoint or Keynote presentation so that you can more simply integrate your slide content with your questions. In an Instructor-Led Synchronous session (online or in person), you can present an entire set of PowerPoint slides (or a portion thereof) in a Slide question. You can move back and forth between the presentation and other Learning Catalytics questions in the same module without losing your place in the presentation. As you present them, the slides appear on students' devices, as well as on your dashboard and in the student window. If you use Office 2016, you need to change the PowerPoint slides to 4:3 aspect ratio before uploading them to the question. |
|