XY from graph (Stress-Strain curves and Bode plot)
Use the XY from graph authoring feature to create questions that require students to solve stress/strain (for Mechanical Engineering and Physics) and bode plot (for Electrical Engineering) problems. You can also use the XY from graph authoring feature for general problems that require students to choose values on a plotted graph.
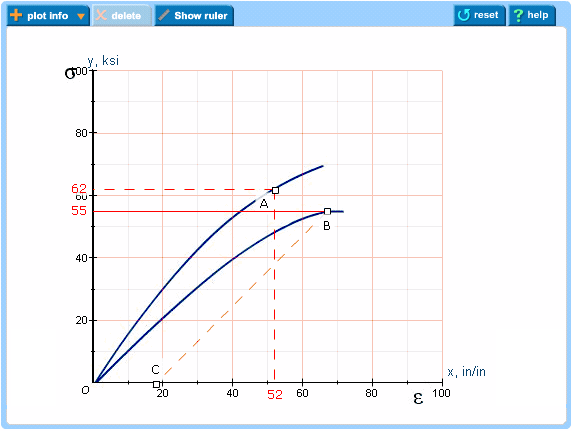
Sample graph plotted using XY from graph
Requirements
To create XY from graph items, you need the Adobe® Flash® Player.
To create an XY from graph item:
In the Item Editor window
- Select Edit in Browser from the Edit Action menu in the upper right.
- Remove the default solutionMultipleChoiceRadio item.
- Under Answer Instructions, select solutionAppletFlash.
- Upload the file for the image by selecting Manage Assets from the Edit Action menu.
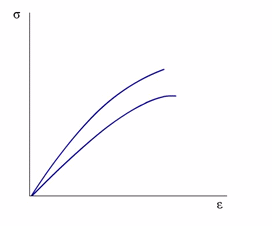
The image you upload should have a white background. Consider drawing arcs or angles in dark blue. Here is a sample image with two curved lines and Greek letters along the x and y axes.
- In the input fields, add the following:
- For Applet Name, enter xy_from_graph.swf
- For Parameters, enter authoring=1&backgroundImage=image.jpg.
- Set Width to 1000 and Height to 1000.
- Click Validate Field and then Preview Item.
You will see the applet in authoring mode. The uploaded image appears behind an X and Y axes with labeled tick marks.
In the Item View window
- Diagram Settings: Using the controls on the right, enter diagram settings (adjust the background image to fit on the graph, add labels to the axes and origin, etc.).
- In the Images control area (lower right), click Position or Align and make your changes.
- [Optional] If it suits your purpose, select a background color other than white using the Background control (lower left).
- In the Axes area, select the X or Y axis tab to click Position and make changes to the Limits or the Length. To add a label, click in the Label checkbox and enter the text in the Label field.
- Click the Origin tab to set the point of origin along the x and y axes, and whether to force its location on the left or on the bottom.
- Element settings: Choose from the following settings to make changes or accept the defaults.
- Elements decimal places settings
Default = 0. Choose the number of decimal places for the x and y axes by clicking arrows to choose values.
- Straight Lines and Lines at an Angle settings
Click Lines Style to adjust Thickness (default = 1 px), Color (default = red), or a (for angle), which is set to 100% by default.
- Slope Elements settings
Click Lines Style to adjust Thickness (default = 1 px), Color (default = red), or a (for angle), which is set to 100% by default.
- "Show ruler in student mode" checkbox
By default, the blue ruler aid is not shown in the graph area when the student first opens the problem. Regardless of this setting, students can always choose whether to show or hide the ruler on the graph. The ruler length, angle, and position are adjustable to help students compare lines in the graph.
- Elements decimal places settings
- Click the Answer Editor tab on the right to add the correct answer and wrong answer responses.
- Correct Answer
Click the Edit (
 ) icon to enter or edit the correct answer. Click Plot Info from above the graph area and choose the type of plot from the available choices:
- x/y on curve
- y value for x at an angle
- slope > linear increasing slope or linear decreasing slope
Tip: Click the student aid Show Ruler to help you compare lines on the graph, as needed. You can resize the blue ruler, change its angle and move it anywhere in the graph.
- Tolerance
Fill in the tolerance settings:
- X-value, for the x-axis tolerance
- Y-value, for the y-axis tolerance
- Angle, for angle tolerance (applicable for only y value for x at an angle)

Special tolerance for "slope"
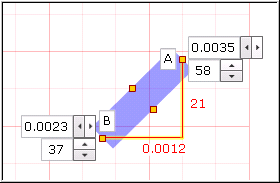
In most stress/strain problems there is usually an empty space in which the student can place the slope. You can set this tolerance visually. In the examples below, the purple rectangular box defines the area in which the student can place the slope. You can extend the box by dragging and releasing your cursor.
This blue area shows a large tolerance:
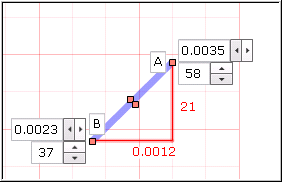
This blue area shows a smaller tolerance:
- Wrong Answers
Click WrongAnswer1 to display a list of wrong answer conditions on the left. Click one or more checkboxes. If you choose more than one condition, both conditions need to be met for a wrong answer response to display. Click the Add button below to add more wrong answer conditions, as needed.
Use the available icons to work with your list of wrong answer conditions.
 = Move up through list of wrong answer conditions
 = Move down through list of wrong answer conditions = Edit
 = Delete
  = Copy
 - In the Altova editor, enter the wrong answer IDs under "Value" and enter wrong answer responses under "Response".
- Click Save to save the configuration file to your desktop. Then upload it, by selecting Manage Assets from the Edit Action menu.
A window appears with the answerString and flashVars strings.
The configuration file contains information about the correct answer and the wrong answer.
If you ever change the correct answer or the wrong answer, you should save and upload the file again. The wrong answer response you write in the Altova editor next to each wrong answer ID is independent of the configuration file, but the wrong answer itself needs to go into the configuration file.
- Copy and paste the answerString string into the Correct Answer(s) field, then copy and paste the flashVars string into the Parameters field. Click OK.
- Before you commit your changes:
- Change the authoring parameter from 1 to 0 to switch to student view.
- Adjust the height and width, if needed.