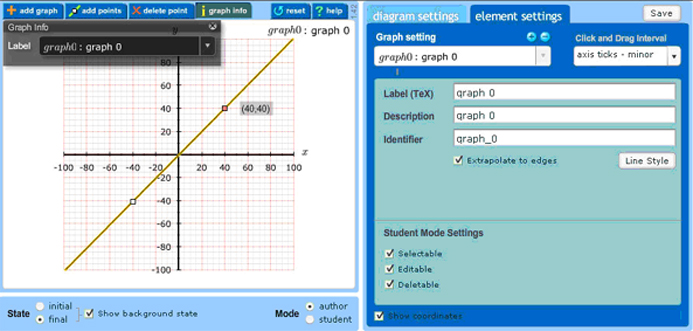
Element settings (for graphing)
To adjust Element and Graph Settings such as label, line width and line color select the element settings tab. You can also control whether students can manipulate any plot that you place in the background.
Note: If you have either a graph or a specific point on a graph selected on the left, and then try to edit anything on the right using the arrow keys, you also adjust the location of your selection. To avoid this, you can just click in a free space in the left window, then your selection becomes inactive and you can use arrow keys in the right section of the window without moving the selected graph or point.
| To . . . | Then . . . |
|---|---|
| Determine the click and drag interval |
Use the drop-down list to set the interval. Avoid adding point by clicking and dragging because these points need to be adjusted slightly. Therefore, it is recommended that the interval be set at either axis ticks – minor or axis ticks – major. |
| Display the (x,y) coordinates of points on the graph |
Check the Show coordinates box:
These coordinates display in the work area next to the selected point. Note that the values displayed are restricted by the resolution of the x and y axes that you established on the diagram settings tab. |
| View information about a graph |
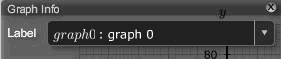
Click the graph info menu button:
This information is displayed in the following manner and is available to students.
|
| Add a new or delete an existing Graph setting |
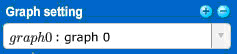
Use the plus/minus buttons:
|
| Delete an existing graph | Delete the Graph setting and then delete the graph from the graph drawing area. |
| Change the label, description, identifier, or style of a graph |
Select the graph whose properties you want to edit using the Graph setting drop-down list:
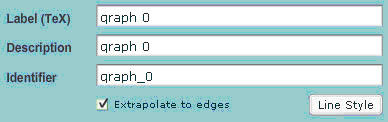
Then make the appropriate changes to the settings:
Note: The label must be coded in TeX. The description must be in plain text (no HTML formatting) and the identifier must be the var-coded equivalent of the label. It is this identifier that gets used in the correct answer string. |
| Switch between initial and final states or to see the item as a student |
Use the State and Mode buttons:
In student mode, you see the initial item and the final correct answer but you can not edit any element or diagram settings. You also can not see the background state. In author mode, if the show background state box is checked and you are the initial state, the graphs composing the final state appear grayed out in the background. Similarly, if the show background state is checked and you are in the final state, you see the initial state grayed out in the background. It is highly recommended that you first work in the final state to set up the correct answer and then copy the graphs that should be initially visible to students into the initial state. To copy a graph from the final state into the initial state or vice versa, you can manually copy it by switching to that other state and clicking on the grayed out graph. In other words, if you create a graph of y = x in the final state that should be present in the initial state, switch your view to the initial state and make certain the show background state” box is checked. You should see the y = x plot grayed out. By clicking on the y = x plot line it will no longer appear grayed out and will be included in the initial state. Note that you only have to copy graphs that you create in one state that are not automatically forced into existence in the other state by the Selectable and Editable rules described below. |


See also:
- Diagram settings (for background and grid)
- Student mode settings