Shear force and bending moment questions
Updated 29 Aug 2024
Complete shear force and bending moment questions on a computer or tablet, not on a smartphone.
 Watch a video: Answer shear force & bending moment questions
To begin, select  Tips Tour to step through quick on-screen tips that identify the controls for drawing or editing bending moment answers.
Select  Toggle Helper (top toolbar) to show or hide keyboard control instructions below the work area.
When available, open the Introduction to Mastering assignment and select the Introduction to Shear Force and Bending Moment Problems item. This assignment provides practice items for different kinds of questions. You can usually return to this assignment anytime during the course, even after its due date. If you completed this assignment, you can usually rework its items for practice.
- Refer to the provided diagram as you work on the graph to answer the question.
- If the graph is below the diagram: The lines of discontinuity will be along the y-axis.
- If the graph is to the right of the diagram: The lines of discontinuity will be along the x-axis.
- Add lines of discontinuity.
- Select
 Add vertical/horizontal line on.
 - Position the lines on the graph.
- Select
- Add a line segment between lines of discontinuity.
- Select
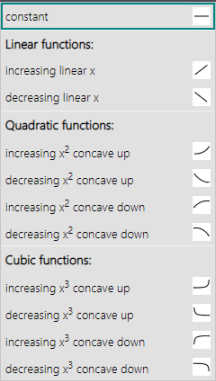
 Add segment to choose whether to draw a constant or to select a type of linear, quadratic, or cubic function.

- Position the line segment between the lines of discontinuity.
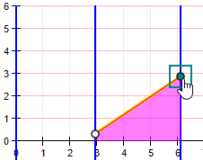
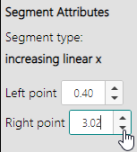
- Check the exact position of the segment endpoints you’ve placed: Point inside the shaded area to see the point values and segment type attributes on the left, where you can make any needed adjustments.
- Select
- Repeat steps 2 and 3 to add more lines of discontinuity and segments.
- To represent maximum/minimum:
Select Add vertical/horizontal line on to add reference lines to represent local maximum/minimum.
Drag the line to its new location on the graph.
- Select the vertical or horizontal line you want to delete from the graph.
- Choose
 Delete Line from the toolbar and then select OK.
Deleting a vertical or horizontal line also deletes any segments with points on the line.
- Select an endpoint on the graph so the segment's attributes show on the left.

- Adjust the values either by selecting arrows or entering a value from your keyboard.

The corresponding point moves on the graph.
- If you change one endpoint of a constant:
The other endpoint changes to match it. - If you move a non-constant segment endpoint to the same level as its other endpoint: The segment automatically changes to a constant.
- If you change one endpoint of a constant:
- Select the line segment or its shaded area from the graph.
- Select
 Change segment from the toolbar to select a different segment type.
- Select the segment line or its shaded area on the graph.
- Select
 Delete segmentfrom the toolbar and OK to confirm.
Other
Select  Reset and OK to confirm.