Graphing questions
Updated 29 Aug 2024
You can submit answers to graphing questions on your computer. Graphing questions are keyboard accessible—keyboard instructions are available below the canvas.

Get started
Select  Launch Tips Tour from the toolbar for quick graphing instructions.
- As you work, keyboard instructions are available below the graphing canvas.
- Press Tab to navigate within the toolbar and Spacebar to select a toolbar option.
- Press Ctrl+Y to get to the attributes pane (when it contains information) and the graphing canvas.
When available, open the Introduction to Mastering assignment and select the Introduction to Graphing Questions item. This assignment provides practice items for different kinds of questions.
You can usually return to this assignment anytime during the course, even after its due date. If you completed this assignment, you can usually rework its items for practice.
Create a graph
- Select
 Add Element from the toolbar.
 -
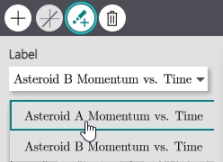
Select a graph label.
The number of provided labels varies by the graphing question. - Select a graph type.
Choose Add Straight Line, which is the only kind of graph available.
 -
Add points by clicking in the graphing canvas. To use your keyboard instead, press the arrow keys to move in the graphing area and then press Spacebar to create the point.
The
 Add Points option is active automatically for a line graph.
To stop adding points: Select
 Stop Adding Points.
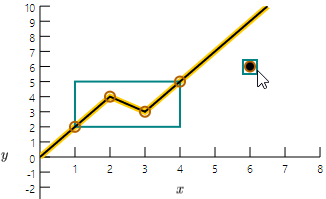
This sample graph shows 4 placed points and a 5th selected point before clicking to add it. The line graph appears as you add points.
To edit your graph: See instructions below.
-
Select Submit when you’re satisfied with your graphing answer.
Edit a graph
Before you select a point or graph: Choose  Stop Adding Points if the Add Points option is active.
- To select a point:
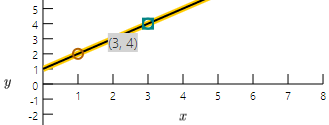
Click on the point so that the point appears in a blue square.Using your keyboard: Press Tab first to select the graph, then to move among its points and select one.

The x,y coordinates of the selected point appear on the graph as well as in the attributes pane. You can select only one point at a time, unless you select the entire line graph.
- To select a line graph: Select any part of the line or press Tab. A selected line graph appears with a yellow highlight.
- To deselect a point or graph: Click in an empty area of the graphing canvas. Or, press Ctrl+Y to get to the canvas and then press Tab.
You can change the position of elements using either of these methods.
Before you move a point or graph: Choose  Stop Adding Points if the
  Add Points option is active.
- Select and drag
From the graphing canvas, select the point or graph (instructions provided above) and drag it to the new location.To use your keyboard instead — Press Tab to first select a point on the graphing canvas and then press any arrow key to reposition the point. To select a graph, press Tab. You may need to press Ctrl+Y first to get to the graphing canvas.
-
Change the x,y coordinates of points
In the attributes pane (left), change the x or y coordinate values in the Points area.
Either overwrite the current value or select an arrow to adjust the value. To get to the attributes pane from the toolbar using your keyboard, press Tab and then Ctrl+Y.
From the Label area of the attributes pane, select the down arrow to choose a different label. You can change the current label only when two or more labels are provided for the graphing question. (You can't edit a label or add a new one.)

- Choose
 Stop Adding Points if the Add Points option is active.
 - Select the point or graph. (Instructions provided above.)
- Choose
 Delete Element.
 - Select Delete when asked to confirm the deletion.
Reset workspace or show/hide keyboard instructions
Resetting the graphing canvas is the easiest way to clear all of your work so you can restart your answer. If you just want to delete some points or an individual graph, see the instructions above.
- Select
 Reset from the graphing toolbar.
 -
Choose OK when asked to confirm the reset.
Keyboard instructions automatically appear below the graphing canvas unless you choose to hide (collapse) them.
Select  Expand or collapse keyboard control from the graphing toolbar.
To use your keyboard instead — Press Tab to navigate to the  Expand or collapse keyboard control on the graphing toolbar. Press Enter to turn the keyboard instructions off or on.