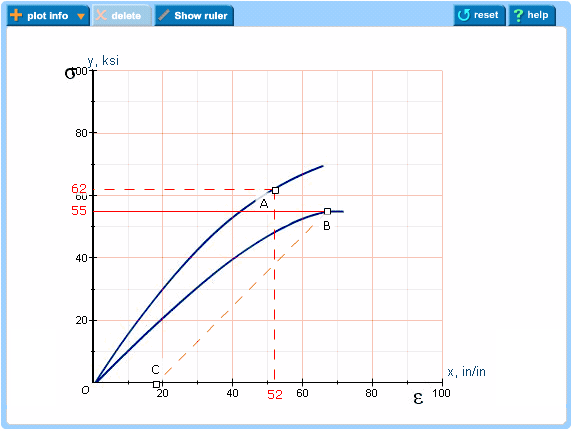
Stress-strain curves or Bode plot questions
Updated 29 Aug 2024
When given a stress-strain or Bode plot, you may be asked to answer in one or more of the following ways—similar to graphing on paper.
- Mark points on these plots.
- Find the slope along a particular segment.
- Find a point on a plot by drawing a line parallel to the linear portion of a curve.

Complete stress-strain curves or Bode plot questions on a computer, not on a smartphone.
When available, open the Introduction to Mastering assignment and select the Introduction to Stress-Strain Questions item. This assignment provides practice items for different kinds of questions.
You can usually return to this assignment anytime during the course, even after its due date. If you completed this assignment, you can usually rework its items for practice.
Add elements to the graph
- Select the
 Plot Info menu from above the graph.
 - Choose x/y on curve point.
- Click on the graph to position and release your cursor, which acts as a crosshair for plotting the point.
The point is formed by two perpendicular, broken lines. The point is labeled, such as D, and its x,y position is provided for you on the graph.
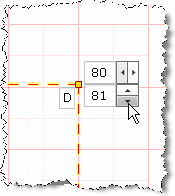
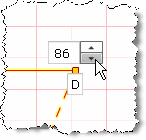
- To refine the location of the point, select the point by pointing to it or any part of the perpendicular lines. (The point and lines become highlighted in yellow.) Then, select the up or down arrows to adjust the value of x or y.

- To draw a line parallel to a part of the curve (similar to using pencil and paper), use the ruler feature.
- Select the
 Plot Infomenu from above the graph.
 - Select y value for an x at an angle.
- Click on the graph to position and release your cursor, which acts as a crosshair for plotting the angle.
The angle displays with the x axis as a solid red line, the y axis as a broken red line, and a labeled point for the value of y.
- To refine the location of the angle and its vertex, select the angle by pointing to it. (The lines become highlighted in yellow.) Then, click on the up or down arrows to adjust the value of y.

- To draw a line parallel to part of the curve (similar to using pencil and paper), use the ruler feature.
- Select the
 Plot Info menu from above the graph.
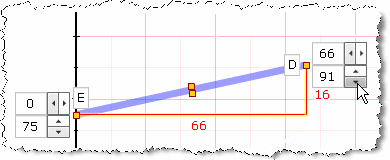
 - Select slope, then choose either linear increasing slope or linear decreasing slope.
- Click on the graph to position the slope, then release your cursor.
The angle displays the x and y axes as solid red lines, with labeled end points. - To refine the location of the slope and its end points, select the slope by pointing to it. (The lines become highlighted in yellow.) Select the up or down arrows to adjust the values for the end points.

Use the ruler drawing aid (not graded)
- Select
 Show Ruler.
A blue ruler appears on the graph. - Place the ruler along the linear part of the curve.
To resize the length of the ruler or to change its angle —
Select either end point and drag or move it.To move the ruler right or left — Use your cursor or an arrow key.
- You can now draw a line (see instructions to add y value for x at an angle) that is exactly parallel to another line.
- Select Hide Ruler when you're done.
Because the ruler drawing aid is not graded, it makes no difference whether you leave this on the graph or not when you submit your answer.
Edit elements you have added
Select the element (whether vertex of an angle, end points for a slope, or anywhere on the ruler) and drag it to the new position.
- Select the element.
- Select
 Delete above the graph.
Reset the workspace
Select  Reset and answer Yes to the question, "Are you sure you want to clear your work?"