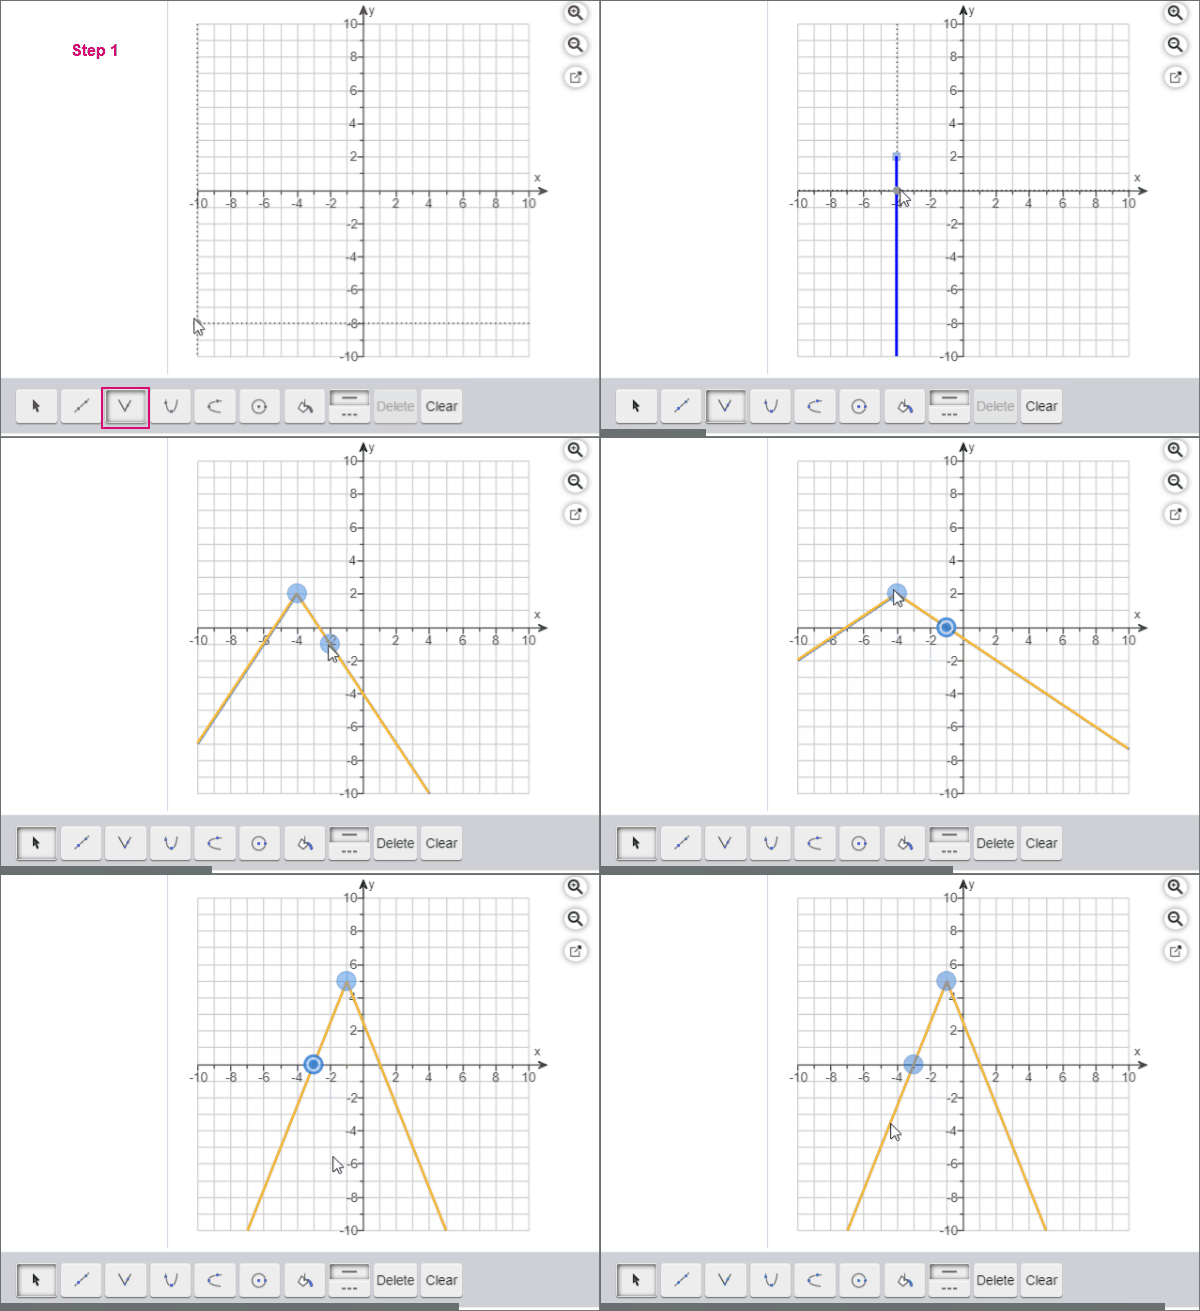
Graph absolute value functions
Plot an absolute value function using the grapher. See this operation in an animated gif.
- Step 1. Select the absolute value tool.
- Step 2. Drag the points/line in the graph to make changes.
- Step 3. Select the line or a point. If your line is selected, the points you plotted are blue and the line is orange. When a point is selected, the point changes to a blue bulls-eye/double circle.
You can add more than one function to your graph.
- Drag the line to a new position.
- Press Shift plus an arrow key to move the function up, down, left, or right.
- Drag the point to the new position.
- Press Shift plus an arrow key to move a selected point.
- If your instructor allows, select Edit Coordinates and enter the new coordinates in the pop-up window, and click Submit.
To remove an absolute value function, press Delete on your keyboard or in the tool palette.
