Graph transformations of sine and cosine functions
You can plot a transformation of a sine or cosine function.
Plot a basic sine or cosine function
To plot a basic sine or cosine function:
- Click the sine tool
 or the cosine tool
  .
. - Click anywhere inside the graph to enter a function or press Enter to display the basic function.
- Use the sliders, text boxes, or check boxes to change the amplitude and horizontal and vertical shift of the wave, as explained below.
You can add more than one function to your graph.
Change the waveform
To transform the sine or cosine function on the graph, make sure it is selected (the line is orange):
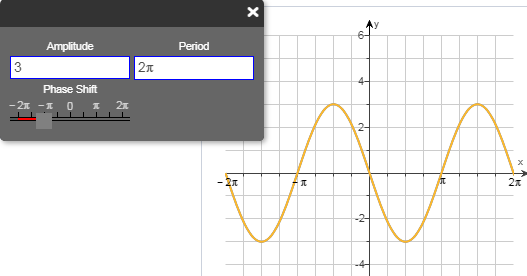
Then, depending on the function:
- Use the slider or change the value in the text box to adjust the amplitude of the curve.
- Use a slider or change the value in an answer box to adjust the period of the curve.
- Use the Vertical Shift slider to move the entire wave vertically.
- Enter a value in the Horizontal Shift text box to move the entire wave horizontally.
- Select a Flip check box to invert the wave over the x- or y-axis.