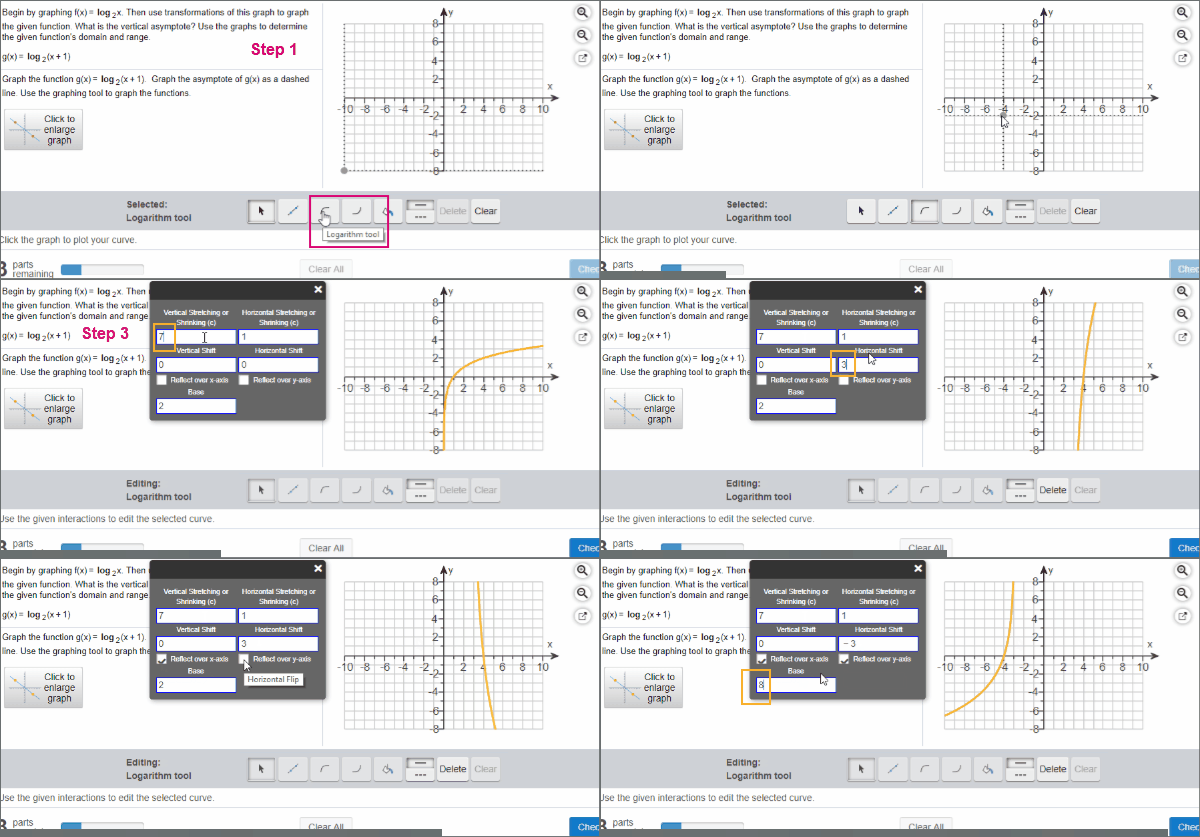
Graph transformations of logarithmic functions
Plot a basic logarithmic function and make changes:
- Step 1. Select the logarithmic tool.
- Step 2. Click anywhere in the graph or press Enter.
- Step 3. To make changes, enter a number into any of the boxes that appear. (If sliders are available, you can use them.)
You can add more than 1 function to your graph.
¨
