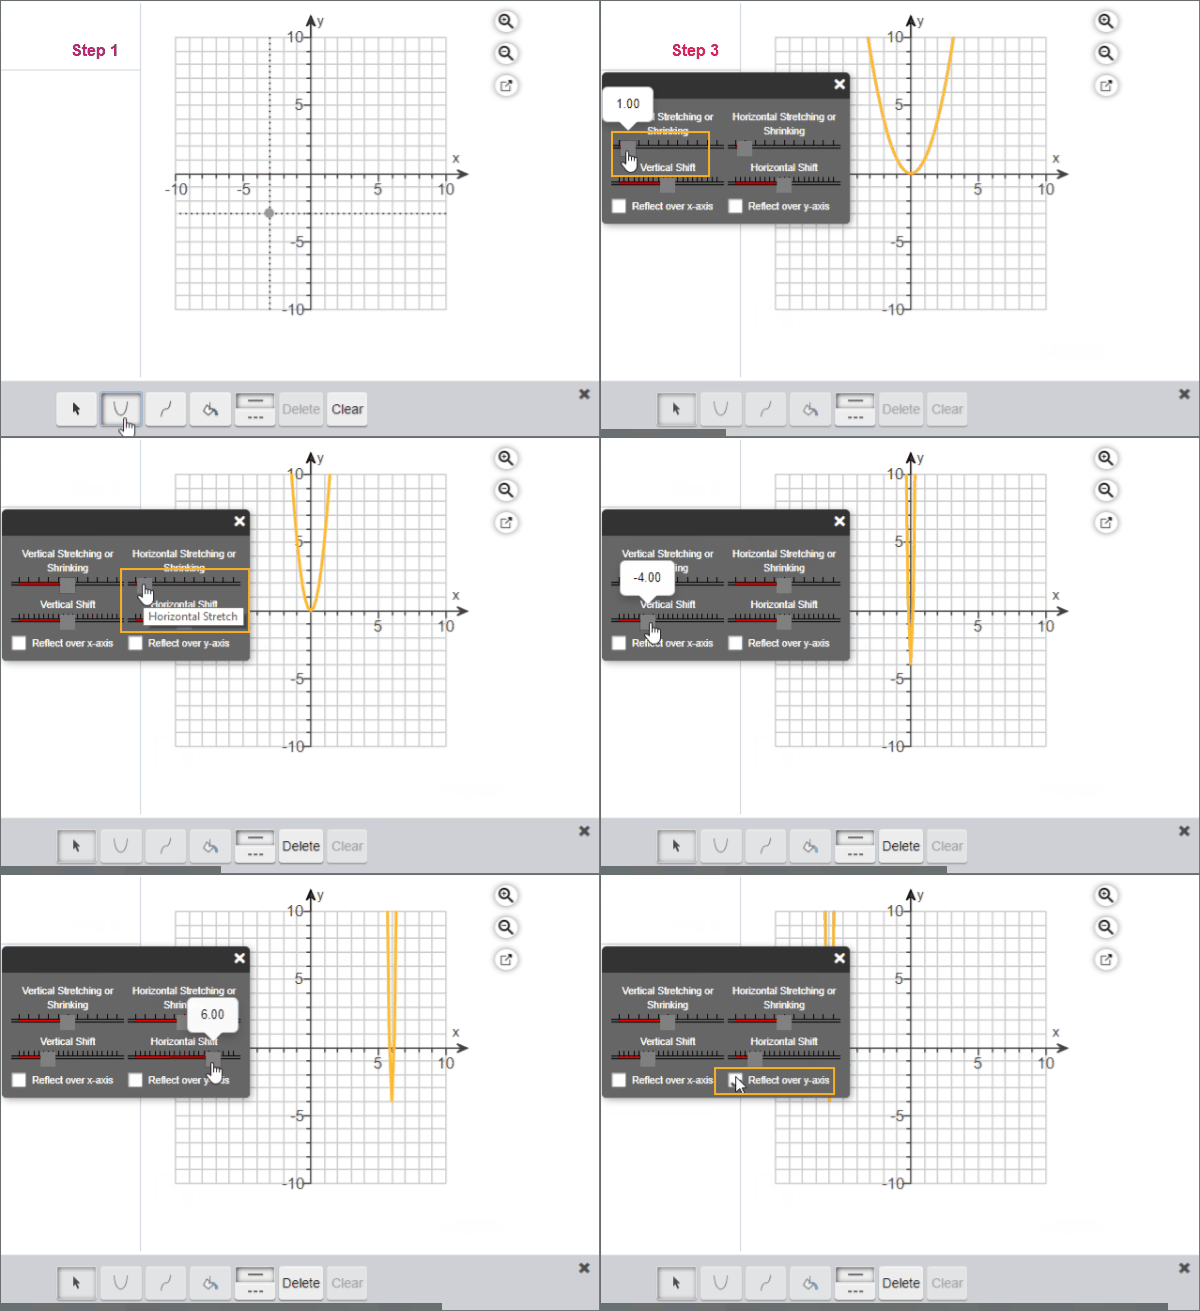
Graph transformations of x-squared functions
Plot a transformation of an x-squared function using the grapher:
- Step 1. Select the x-squared tool.
- Step 2. Drag the point to locate the basic function.
- Step 3. To stretch/shrink the curve vertically/horizontally, use the slider or change the value in the text box.
- Step 4. To shift the entire curve horizontally/vertically, use the slider.
- Step 5. To reflect the entire function over the x- or y-axis, select the x/y check box.
You can add more than 1 function to your graph.
¨
