Graph functions
Updated 26 Jul 2021
You can plot functions using the grapher.
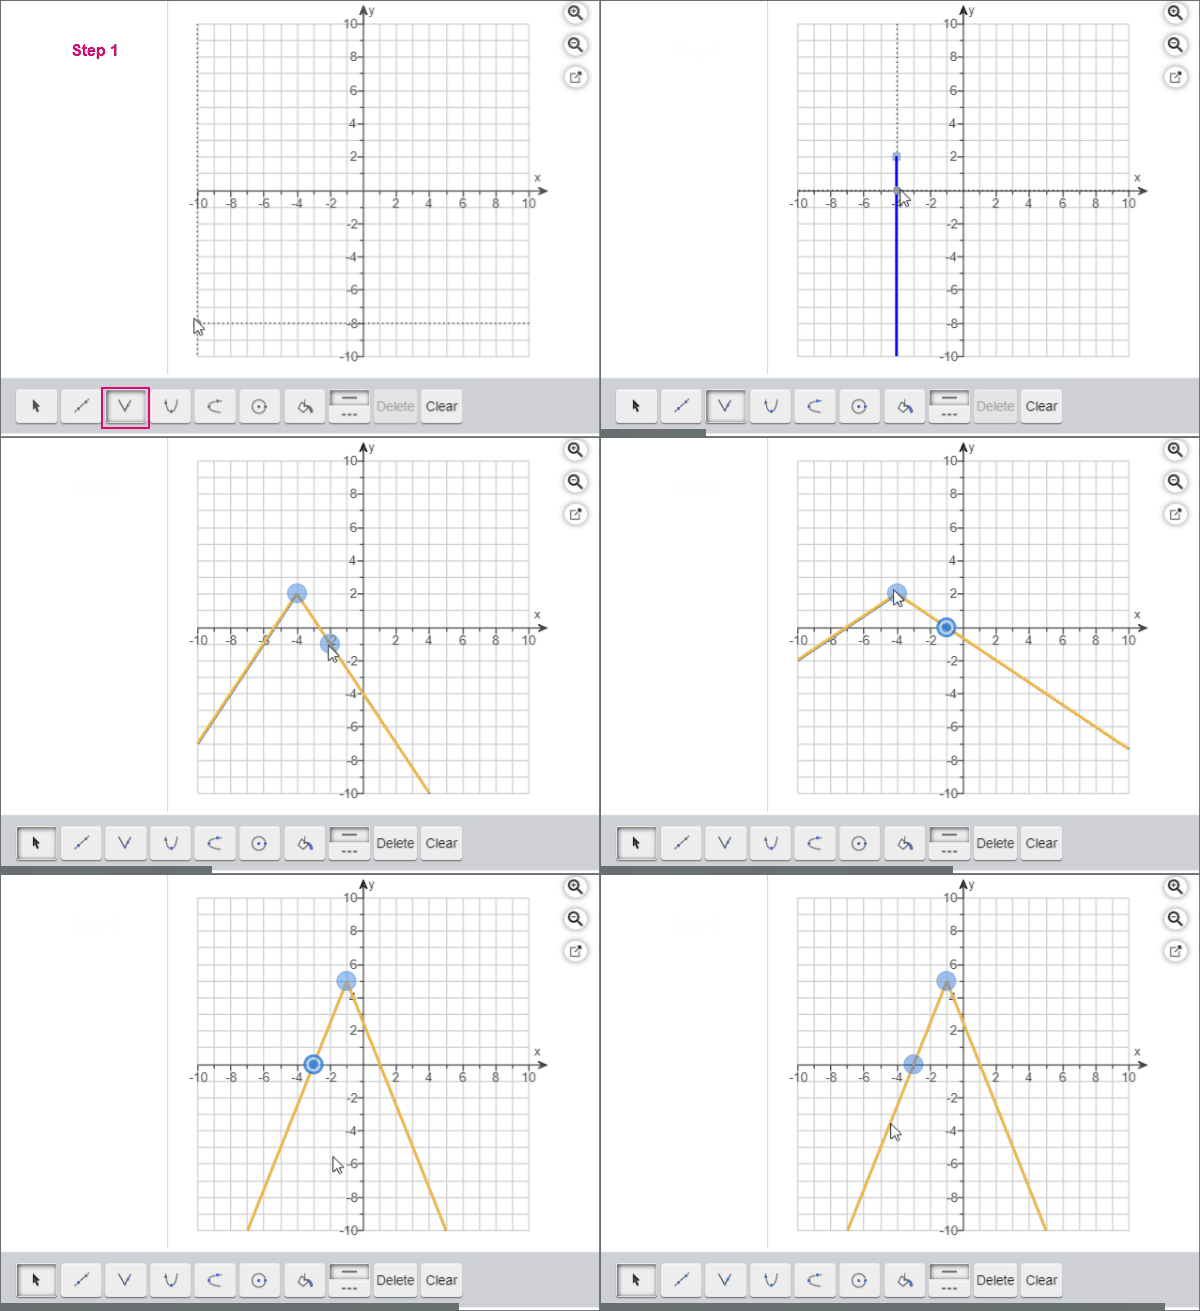
- Select the absolute value tool
 .
. - Drag the points or line in the graph to the correct positions.
You can add more than one function to your graph.
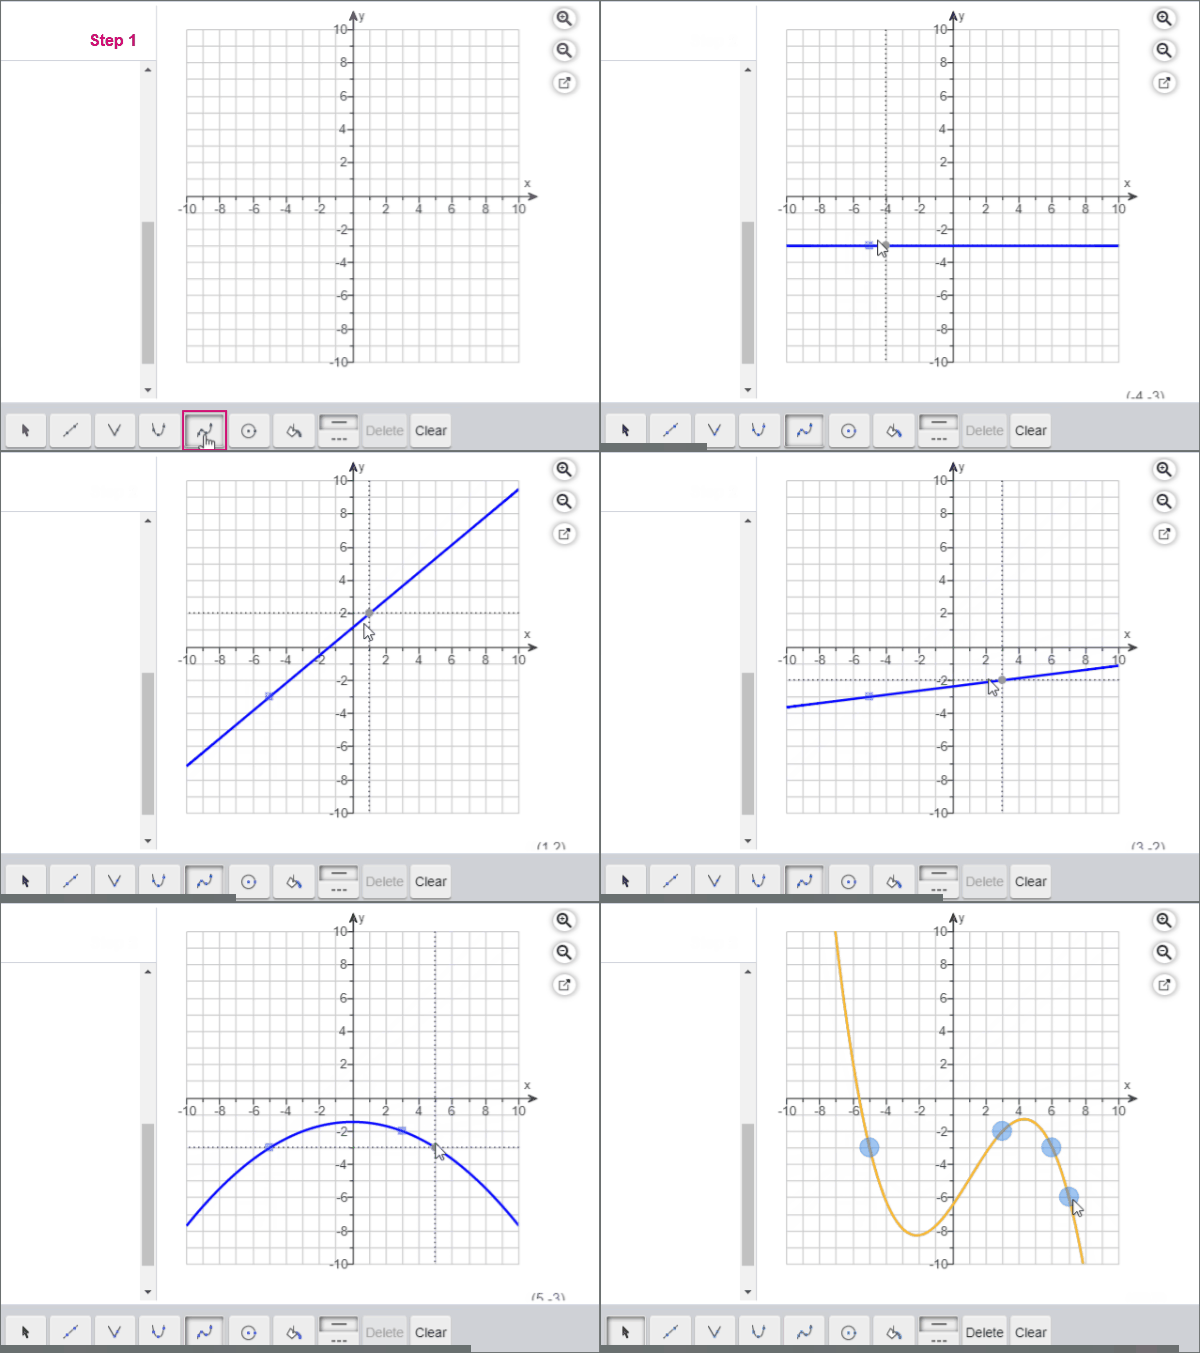
- Select the 3-point quadratic tool
 .
. - Click or tap in the graph to locate the first point of your curve.
- Move to the next point on your function.
- Click or tap to graph the point.
- Select the 4-point cubic tool
 .
. - Click or tap in the graph to locate the first point.
- Drag to locate the second, third, and fourth points.
You can add more than one function to your graph.
Use the selection tool  to select the function line or point.
- When your line is selected, the points are blue and the function line is orange.
- When your point is selected, it changes to a blue bulls-eye/double circle.
Select the line or a point. If your line is selected, the points you plotted are blue and the line is orange. When a point is selected, the point changes to a blue bulls-eye/double circle
To change a function, either:
- Drag the line to a new position.
- Press Shift plus an arrow key to move the function up, down, left, or right.
To change a point, either:
- Drag the point to the new position.
- Press Shift plus an arrow key to move a selected point.
- If your instructor allows, select Edit Coordinates and enter the new coordinates.
To remove a function, press Delete on your keyboard or in the tool palette.

