Graph transformations of functions
Updated 26 Jul 2021
- Select the x-squared tool
 .
. - Click or tap in the graph or press Enter to enter the function.
- Use the slider or change the value in the text box to format the curve vertically/horizontally.
You can add more than one function to your graph.
- Select the x-cubed tool
 .
. - Click or tap in the graph or press Enter to enter the function.
- Use the slider or enter the values in the text box to format the curve.
You can add more than one function to your graph.
- Select the logarithmic tool
 .
. - Click or tap in the graph or press Enter to enter the function.
- Enter the values in the text box to format the curve.
You can add more than one function to your graph.
- Select the exponent tool
 .
. - Click or tap in the graph or press Enter to enter the function.
- Enter the values in the text box to format the curve.
You can add more than one function to your graph.
- Select the sine tool
 or the cosine tool
  .
. - Click or tap inside the graph or press Enter to enter the function.
- Make sure the waveform is selected (the line is orange):
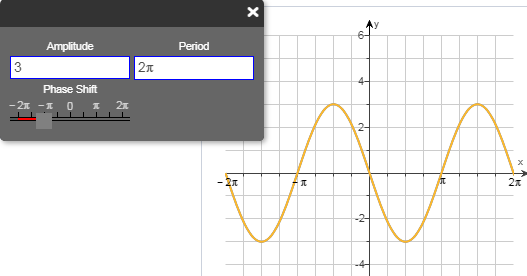
- Depending on the function:
- Use the slider or change the value in the text box to adjust the amplitude of the curve.
- Use a slider or change the value in an answer box to adjust the period of the curve.
- Use the Vertical Shift slider to move the entire wave vertically.
- Enter a value in the Horizontal Shift text box to move the entire wave horizontally.
- Select a Flip checkbox to invert the wave over the x- or y-axis.
You can add more than one function to your graph.