Example: Use a bar chart in a math question
Updated 16 Jun 2023
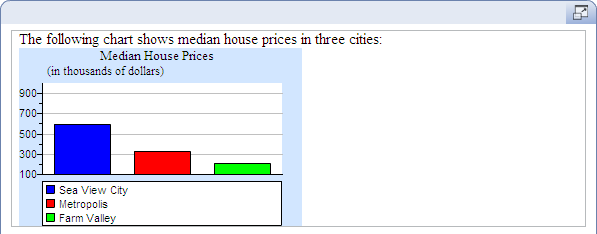
In this example, you create a question with a simple bar chart that shows median house prices in three communities: Sea View City (median price = $595,000), Metropolis (median price = $325,000), and Farm Valley (median price = $210,000). To create the bar chart:
- For the question, enter:
The following chart shows median house prices in three cities: - Press Enter to go to a new line and click Bar
Chart under Math Objects in the left menu.
The Edit Bar Chart window appears.
- On the Graph tab, enter
Median House Pricesin the Title box and then click the Axis tab. - On the Axis tab, enter the following:
- In the Title
box, enter:
(in thousands of dollars). - In the Minimum box, enter
100. - In the Maximum
box, enter
999. - Enter
100in the Tick Spacing box. - Under Axis Label, select Label Every and enter
2for the number of ticks.
- In the Title
box, enter:
- Click the Bars tab.
- On the Bars tab, click Add three times to create the bars. The list of bars displays in the box at the top of the window.
- Select the first entry in the
box at the top of the window and edit the bar as follows:
- In the Value
box, enter
595. - In the Bar Label
box, enter
Sea View City.
- In the Value
box, enter
- Select the second entry in the
box at the top of the window and edit the bar as follows:
- In the Value
box, enter
325. - In the Bar Label
box, enter
Metropolis.
- In the Value
box, enter
- Select the last entry in the
box at the top of the window and edit the bar as follows:
- In the Value
box, enter
210. - In the Bar Label
box, enter
Farm Valley.
- In the Value
box, enter
- Use the Chart Size and Height sliders to adjust the size of the bar chart.
- Click Save to enter the chart in your question. Your final bar chart looks like this:
