Example: Use a pie chart in a math question
Updated 28 Aug 2023
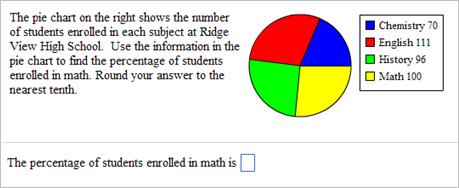
In this example, you ask your students to use the data in a pie chart to figure out the percentage of students enrolled in a subject. The data values and subject are algorithmic.
You want your question to look like this:

First create the question and the algorithmic value:
- Open the Custom Question Builder.
- Select Start with an empty template and click Next.
- Select the format Top/Bottom and click Next.
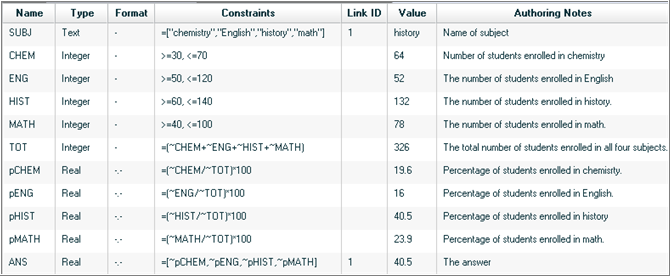
- Create the following algorithmic values. See Creating and editing algorithmic values for details on how to create algorithmic values.
| Name | Definition | Constraints |
|---|---|---|
| ~SUBJ | The name of the subject | A text value: chemistry, English, history, math. List these values in this order. In the Options tab, enter a Link ID value of 1. |
| ~CHEM | The number of students enrolled in chemistry | An integer between and including 30 and 70 |
| ~ENG | The number of students enrolled in English | An integer between and including 50 and 120 |
| ~HIST | The number of students enrolled in history | An integer between and including 60 and 140 |
| ~MATH | The number of students enrolled in math | An integer between and including 40 and 100 |
| ~TOT | The number of students enrolled in all four subjects | An integer, equal to (~CHEM+~ENG+~HIST+~MATH) |
| ~pCHEM | The percentage of students enrolled in chemistry | A decimal to 1 place, equal to (~CHEM/~TOT)*100 |
| ~pENG | The percentage of students enrolled in English | A decimal to 1 place, equal to (~ENG/~TOT)*100 |
| ~pHIST | The percentage of students enrolled in history | A decimal to 1 place, equal to (~HIST/~TOT)*100 |
| ~pMATH | The percentage of students enrolled in math | A decimal to 1 place, equal to (~MATH/~TOT)*100 |
| ~ANS | The answer | A decimal to 1 place. List the four percentage values in order of the subject. In the Options tab, enter a Link ID value of 1. |
The Link ID option synchronizes the SUBJ and ANS values. By entering 1 in the Link ID box, you ensure that items are selected from the same position in both lists when the values are randomly selected.
When you are finished, your algorithmic values list looks like this:

To enter your question and the pie chart:
- To position the pie chart to the right of question, create a table in the problem statement area:
- Click the table icon (
 ) to open the Insert Table window.
 - For Number of columns, enter
2. - For Number of rows, enter
1. - Click OK to enter the table into the question.
- Click the table icon (
- Enter the problem statement in the left cell of the table:
The pie chart on the right shows the number of students enrolled in each subject at Ridge View High School. Use the information in the pie chart to find the percentage of students enrolled in ~SUBJ. Round your answer to the nearest tenth. - Place your cursor in the right cell of the table and click Pie Chart in the left menu to open the Edit Pie Chart window.
- On the Pie tab, choose Medium as the pie size. Then click Next.
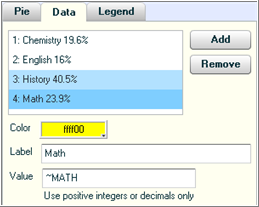
- On the Data tab, click Add to enter each wedge in your pie. Your entries in the Label and Value boxes should be:
Chemistry English History Math Label: Chemistry Label: English Label: History Label: Math Value: ~CHEM Value: ~ENG Value: ~HIST Value: ~MATH When you have entered values for all four wedges, you see your pie chart on the right and your Data information should look something like this:

The Custom Question Builder automatically assigns a different color to each wedge, but you can click in the Color box to choose a different color.
- Click Next.
- Under Label Format on the Legend tab, choose Data Values. Then click Save to enter the pie chart in your question.
- In the Interaction Area, enter:
The percentage of students enrolled in - Enter a space, click Algorithmic Values, and choose SUBJ from the list.
- Type
isand a space and click Short Answer to open the Edit Answer Definition window:- On Step 1, select Specify a subset of equivalent answers to accept and Accept integer of decimal equivalents only.
- On Step 2, click into the row under Value and enter
~ANS. - On Step 3, choose 1 as the number of decimal places.
- Click Next and then click Save on Step 4.
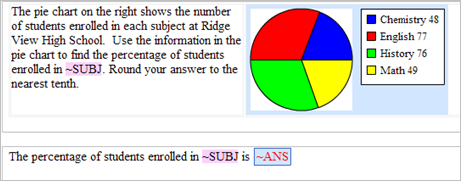
When you display algorithmic values names, your question looks similar to this:

- Click Preview Exercise to see how your question looks for your students. Enter the correct answer and an incorrect answer to check the behavior.
- When you are satisfied with your question, dismiss the Preview window and click Save.