Use the grapher
When you answer graphing questions, the grapher displays in the player.
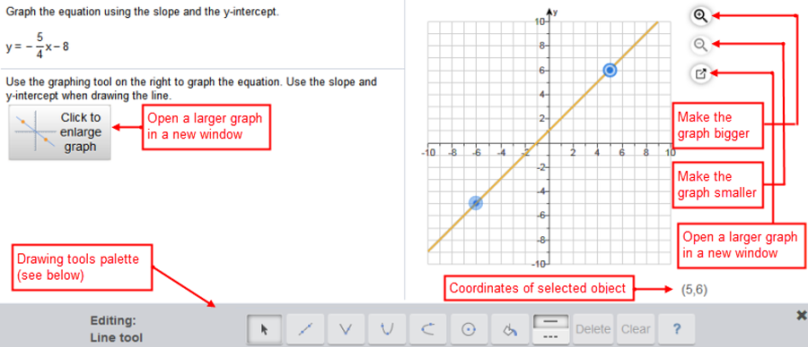
To enter your answer:
- Optionally select either Click to enlarge graph or
 to enlarge the grapher.
 - Click or tap in the grapher to open the drawing tools palette.
- Use the graphing tools to enter your answer.
- Select Save to submit your graph.
The graphing tools
| Icon | Use |
|---|---|

|
Line — Draw a line between 2 points. |

|
Multi-point curve — Draw a curve with multiple points. |

|
Circle — Draw a circle. |

|
Vertical parabola — Plot a vertical parabola. |

|
Horizontal parabola — Plot a horizontal parabola. |

|
Absolute value — Graph an absolute value function. |

|
3-point quadratic — Graph a 3-point quadratic function. |

|
4-point cubic — Graph a 4-point cubic function. |

|
X-squared — Graph a basic x-squared function and transform it. |

|
X-cubed — Graph a basic x-cubed function and transform it. |

|
Logarithm — Graph a basic logarithmic function and transform it. |

|
Exponential — Graph a basic exponential function and transform it. |

|
Sine — Graph a basic sine function and transform it. |

|
Cosine — Graph a basic cosine function and transform it. |

|
Region shading — Shade an area in your graph. |

|
Solid/Dashed line — Change the line of the selected object to solid or dashed. |