 .
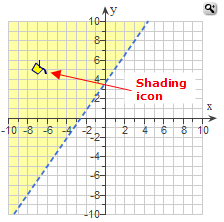
.After you have shaded a region in your graph, you see the shading icon in the region.

You can shade areas in your graph and choose whether lines are solid or dashed. If you are plotting transformations, you can use sliders, text boxes, or checkboxes to transform the object.
Transform an object
To shade a region in your graph:
 .
.After you have shaded a region in your graph, you see the shading icon in the region.

To change a shaded region:
To delete shading:
To change a line style:

 :
:
When you are plotting a transformation of an x-squared, x-cubed, logarithmic, exponential, sine, or cosine function, you can use sliders, text boxes, or checkboxes to transform the object.
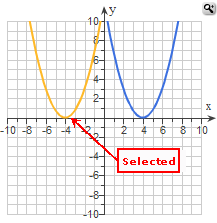
To transform the object, first select it. The sliders, text boxes, or checkboxes appropriate to the function appear next to the graph grid.
Then select the values using sliders. For example:


Or enter values in text boxes. For example:
