 or horizontal
  parabola tool.
As you move the cursor, a temporary line appears so you see what your final parabola will look like.
Your completed parabola appears and is selected.
Using the grapher, you can plot both vertical and horizontal parabolas.
To plot a parabola:
 or horizontal
  parabola tool.
As you move the cursor, a temporary line appears so you see what your final parabola will look like.
Your completed parabola appears and is selected.
You can add more than one parabola to your graph.
To select a parabola:
 .
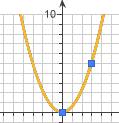
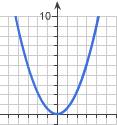
.If your line is selected, the points you plotted are blue and the parabola line is orange. When a point is selected, the point is orange.
| A selected parabola | An unselected parabola |
|---|---|
 |  |
To change or delete a parabola, first select it.
Move a selected parabola in one of these ways:
Change a selected point in one of these ways:
Delete a selected parabola in one of these ways: