Background grid appearance (Mohr's circle questions)
Updated 17 Sep 2025
Use diagram settings to set the appearance of the background grid in a Mohr's circle question.
- From a Mohr's circle Answer box, select
 to open the graphing tool and settings for the question.
 - Select diagram settings to set the appearance of the background grid, including its lines, tick marks, and labels.
(It doesn’t matter whether “Initial plot location” or Correct answer” is selected in the drawing tool.)
- Instructions are provided in the sections below.
- If working on a laptop, the settings box may appear below the workspace.
- Choose Save (bottom right) to return to your view of the item in the Simple Editor.

Select the x or y tab to edit the appearance of that axis on the background grid.
- To change the width of the axis:
Change the Widthvalue to a new length measured in pixels. A higher value can decrease the circle viewing size (not its radius). - To set the resolution of an axis line:
Accept or edit the default 1-pixel resolution (line thickness) value.
Use the Line check box to set the axis line style.
- To change the style of the axis line:
Select Line Style. A window opens with settings, such as line thickness. The default color for axis lines is black. The Alpha % is for opacity, where 100% is full strength and 0% is transparent (not visible). You can also change from a solid to dashed line, with control over both the Line and Gap length.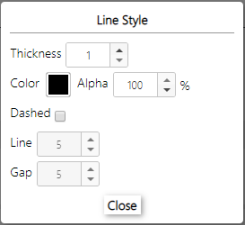
To set the spacing and type of major and minor axis tick marks, use the Ticks check box. For instructions, see the next section.
Use the Ticks check box to set the major and minor axis tick spacing, type of tick, tick label style, and tick label position.

Hide/show tick marks
When applied, minor tick marks appear between major tick marks.
- Hide both the major and minor tick marks:
Do not check the Ticks check box. - Hide only the major tick marks or only the minor tick marks:
Do not check the major or minor check box.
Set tick mark appearance
- To set the spacing of the axis tick marks:
Enter a value for Interval. This determines which axis values are marked with a tick and label (if labels are set to display). For example, if you set the major interval to 20, then tick marks appear on the axis at 20, 40, 60, and so on. - To change the thickness, style and Alpha (opacity) of the tick marks:
Select Line Style. A window appears containing these settings. Tick marks may be too short to allow them to be dashed. For opacity, an Alpha setting of 100% is full strength and 0% is transparent (not visible).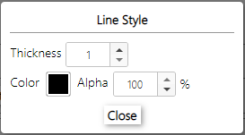
Set axis value label appearance for tick marks
- To hide axis value labels:
Remove the check in the Labels check box. - To change the number of decimal places displayed on the axis value labels:
Enter a value for the Labels decimal places. - To change the amount of space between the tick mark and the labels:
Adjust the Offset.
Select Grid to make changes to the grid lines. When applied, minor grid lines appear between major grid lines.
- To change the spacing between the grid lines:
Enter a value for Interval. If you apply minor grid lines, use a smaller value than is used for major grid lines. - To change the style of the grid lines:
Select Line Style. A window opens with settings, such as line thickness. The default color for grid lines is red. The Alpha % is for opacity, where 100% is full strength and 0% is transparent (not visible). You can also change from a solid to dashed line, with control over both the Line and Gap length.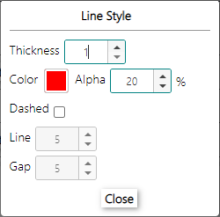
Use the Label check box to assign an axis label and its position relative to the axis.
Select the x or y axis, choose an exponent value (if applicable), and enter the axis label.

See also: