Background grid appearance (vector moment questions)
Updated 17 Sep 2025
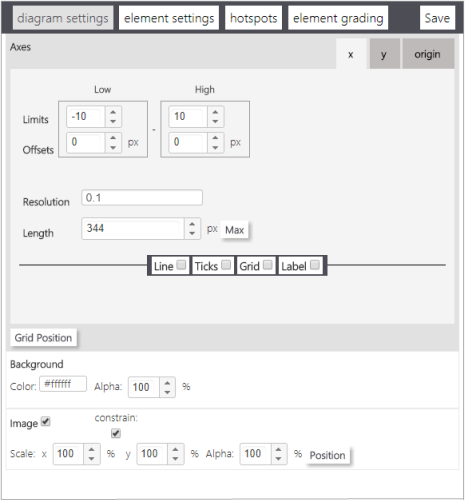
Choose diagram settings to set the appearance of the diagram in a vector moment question, including the background grid, x and y axes, lines, tick marks, labels, as well as the background image and colors.
- Diagram settings apply to ALL answer strings, not just the string being edited.
- You may need to select Edit Answer to make the diagram settings available for editing.
- When you finish making your diagram settings edits, choose Save (top right) from the settings box. Your view will return to the correct answer string for the question.
Select the x or y tab to edit the scale and appearance of the grid for that axis. You can control the scale, resolution, and length of each axis.
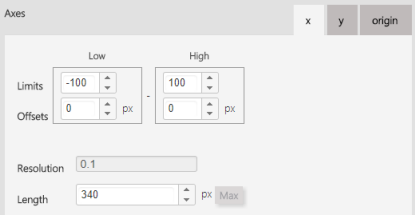
- To change the scale of an axis
Change the low and high Limits to the values you want. - To change the resolution of an axis
Set the Resolution to the value you want. This number is in graph units and determines where you are able to place points on the background. For example, if the resolution is set to 1, you can only place points on a graph at locations that correspond to integer values on the background grid – (1, 1) not (0.50, 0.80). - To change the length of the axis
Change the Lengthvalue to the new length measured in pixels. - To set the length to the maximum possible
Select Max. - To change the relative position of the ends of the axis to the end of the axis scale
Change the Offsets. If you want the end of the axis to align with the end of the grid scale, the Offsets should be set to 0. A non-0 offset extends beyond the end of the grid scale.
Use the Line check box to set the axis line style and indicate whether or not there are arrowheads on the ends of the axis.
- Hide the axis line in the work area
The Line check box must be cleared. - To add an arrowhead to the end of the axis line
Check the appropriate Arrow boxes.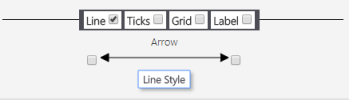
- To change the style of the axis line
Select Line Style. A window opens with settings, such as line thickness, color, and a(alpha) for transparency.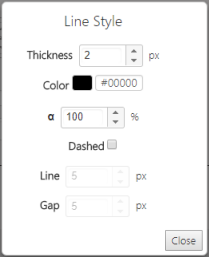
You can also change from a solid to dashed line, with control over both the Line and Gap length.
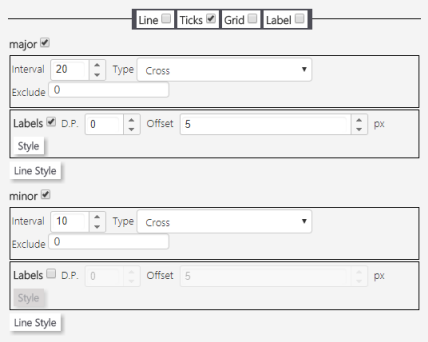
To set the spacing and type of major and minor axis tick marks, use the Ticks check box. See next section below for instructions.
Use the Ticks check box to set the major and minor axis spacing, type of tick, and label style.
Hide/show tick marks
- To hide both the major and minor tick marks
Do not check the Ticks box. - To hide only the major tick marks or only the minor tick marks
Do not check the major or minor check box.
Set tick mark appearance
- To set the spacing of the axis tick marks
Enter the Interval you want. This determines which axis values are marked with a tick and label (if labels are set to display). For example, if you set the major interval to 20, then tick marks appear on the axis at 20, 40, 60, and so on. - To change the type of tick mark used
Select inside, outside, or cross from the Type drop-down list. - Keep certain axis values from having tick marks or labels
Enter the values into the Exclude text box. Values should be comma separated. - To change the thickness, color, style and transparency (a) of the tick marks
Select Line Style. A window appears containing these settings. Tick marks may be too short to allow them to be dashed.
Set axis value label appearance
- To hide axis value labels
Do not check the Labels box. - To change the font size and color of the axis value labels
Select the Style button and change the settings in the pop-up window. You cannot change the font type. - To change the number of decimal points displayed on the axis value labels
Adjust the D.P. setting. - To change the amount of space between the tick mark and the labels
Adjust the Offset.
Use the Label check box to set the axis label and set its position.
- To change the axis label
Enter a new label coded in TeX into the Label (TeX) text box. - To change the distance between the label and the axis
Adjust the Offset. - To change the orientation of the label
Select the vertical or horizontal character for Rotation. - To change the position of the axis label
Select Position to view the Position window. Place the label at any of 8 label locations on the rectangular perimeter around the x or y axis. Label locations are indicated by square markers.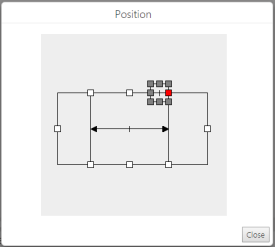
To change the position of the background grid, select Grid Position to view the Position window.
- Change the location of the center of the background grid
Adjust the x and y pixel settings or make the grid draggable, and then drag the grid to its new location. - To center the background grid
Select Center.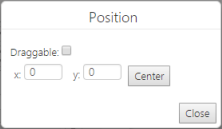
Select the origin tab to edit the origin label and location in the background grid.
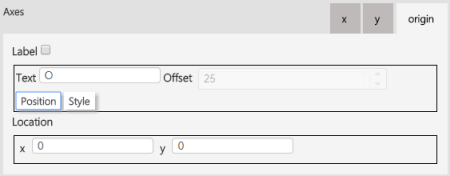
- To hide the origin label
Clear the Label check box. - To change the label marking the origin
Replace the text in the Text box. The default text is the uppercase letter O for “origin”. - To change the distance between the label and the origin
Replace the text in the Text box. The default text is the uppercase letter O for “origin”. - To change the position of the origin label
Select Position to load the Position window. You can place the label at any of the 8 label marker locations on the circle around the intersection of the x and y axes.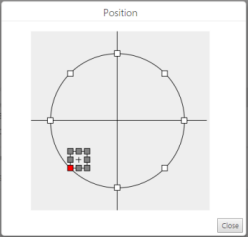
- To change the font size and color of the origin label
Select Style and change the settings in the window that appears. You cannot change the font type. - To change the location of the origin
Enter the new x and y coordinates of the origin in the Location area.
To adjust the background color and image settings, use the controls at the bottom of diagram settings.
Background color
This is the background color of the workspace.
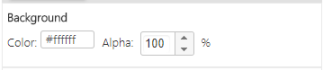
- Color
Either enter a hexadecimal color code after the # symbol or select a color from the color picker.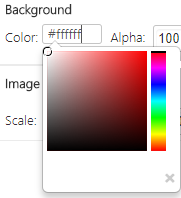
- Alpha
To adjust the opacity of the background image, change the Alpha setting, where 100% is completely opaque and 0% is completely transparent (i.e., not visible).
Image color
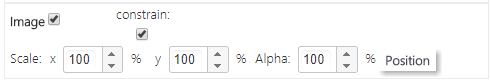
- Image
To hide the background image from view in the work area, clear the Image check box. Default is a check mark - Constrain
The constrain condition ensures that the width and height of the image are scaled at the same ratio so the image does not look skewed. - Scale
To change the size of the background image, adjust the x and y scale settings. Default is 100%. - Alpha
To adjust the opacity of the background image color, change the Alpha (a) setting, where 100% is completely opaque and 0% is completely transparent (i.e., not visible). - Position
To adjust the placement of the background image in the workspace, select Position. A box appears that allows you to check a box to make the image draggable, move the center of the image to a different x and y pixel location, or select Center to center the image (x= 0, y=0). Choose Close when you are finished.
See also: