Assignments
See how well students are performing on their assignments. See the Overall Score, Homework Score, Quiz Score, and Test Score. Each score is averaged for the selected course(s). Also see the number of completed assignments compared to the total number assigned.
- This list shows you your active courses, your previous courses, and courses that others have shared with you.
- The most number of courses you can select is 25.
- If you make multiple selections, the course names in the Course box are replaced by the number of selected courses.
- When you apply one or more filters on the Assignments page and navigate to another page, the filters also apply to the information on the selected page.

- One course — Select to return analytics on this course.
- Multiple courses:
- Choose Multi-select.
- Select Apply to see the analytics for the selected courses.
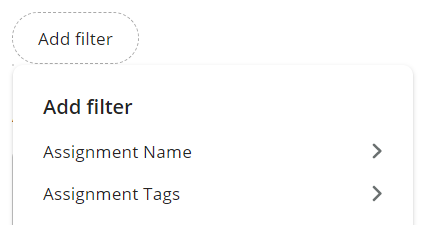
- Select Add Filter and the filters slide out shows:

- Select assignment options under Assignment Tags and Assignment Name.
- Select Apply to show only the specified data and to see the applied tags.
- (If added from the Performance Analytics overview page) Select Clear All or any other tag(s) to remove the filters applied to this page. When you remove the filters, you see all the assignments for the selected course(s).
- Enter an assignment name into Search. Locate only the analytics for the selected assignment.
Filter by Assignment Performance or Student Score Breakdown
To filter Homework Score, Quiz Score, and Test Score, select the link below the percentage for any of these values:

Show only the assignments where students placed into one or more performance groups (Low Performing, At Expectation, and High Performing):
- Select Filter and a list of performance groups appears.
- Select one or more check box(es) for the performance group(s).
- Select Apply Filters and see the assignments and performance metrics for the selected group(s).
- (Optional) Use the assignments table to compare assignments and identify low-performing students.
- (Optional) Go to Adjust performance groups.
When you apply one or more filters on the Assignments page and navigate to another page, the applied filter(s) transfers to the page to which you navigated.
- Type — See the Homework (HW), quiz, or test.
- (if more than one course is selected) Course Title — See the course associated with this assignment.
- Assignment Name — See the assignments listed by name.
- Avg Time — See the average amount of time students spent completing the assignment.
- Avg Score — See the average score students received for the assignment. (If the assignment due date passed without a student submission, the Gradebook is blank and you must manage incompletes.)
- Submissions — See the number of times this assignment was submitted to you.
- Low Performing — See the number of students who performed poorly on the assignment. This number is shown in a pink box.
- To sort assignment table information, select one of the columns (such as Submissions). Sort using the ascending or descending button
 .
. - Select a row to access this information on the Student List page.
- The Overall Score does not match the Overall Score in my Gradebook — The Performance dashboard does not currently take into account Gradebook weighting or offline assignments.
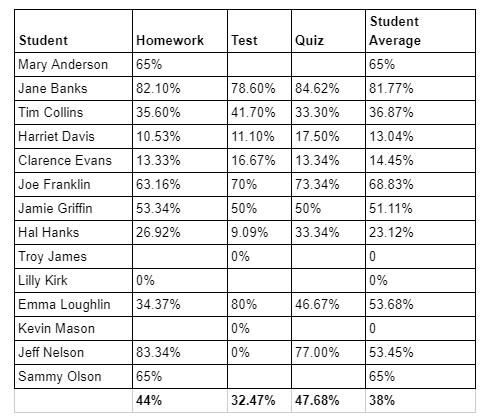
- The Overall Score does not align with the displayed assignment type averages — In Performance Analytics, student averages are calculated using only the assignments that have a score, as shown in the example.

Blank cells represent assignments that have not been submitted or that have no score. Any assignment that does not have a score in the Gradebook is not factored into the average.
The averages shown at the bottom of the assignment columns are the averages displayed as the calculated averages in the Assignment Performance section of the Performance Overview. These averages help you see if and where students are struggling with their assignments.
Updated 15 Sep 2025