Diagnostic charts (standard assignment)
Updated 07 Jan 2026
Diagnostic charts let instructors
Score, time, and difficulty data is reported in the Diagnostics. You can sort chart data, filter out some kinds of data, and hide/show individual diagnostic charts. Diagnostic charts are unavailable for assigned Interactive Labs and specialized assignments like Dynamic Study Modules.
- Select a standard Mastering assignment title, whether from the Assignments page (
 List View or
  Calendar View) or from the Gradebook.
 - Select Diagnostics.

- Adjust your view of the data in any of the following ways:
- Sort data in a chart — In charts that have a Sort option, select an option to reorder chart data. For example, you can sort student completion times from high to low in the Student Assignment Results chart.
- Filter out some data in a chart — Select a type from the chart's legend to hide that particular data. For example, you can hide Item Difficulty data in the Item Results chart. The option then appears with a strikethrough. To turn it back on, select the option again.
- Hide/show charts — Select
 (top right) to hide any chart. To add it back, choose the chart name (top left) and select Add.
 - Enlarge your view of charts — Use your laptop zoom feature, like Ctrl + for Windows or Command + for Mac OS.
 "No longer valid" message in some charts...
For courses created before late Dec 2020, close any older charts with this message so you can focus on the latest populated charts.
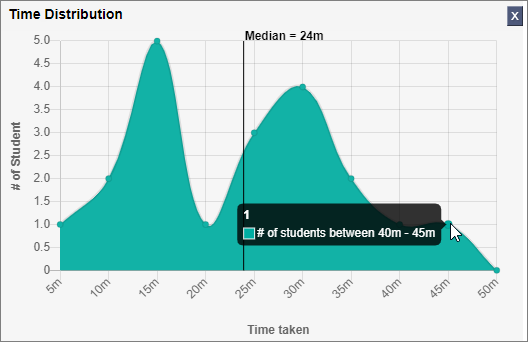
Use the Assignment Time Distribution chart to check the median time and the number of students who spent the most or least amount of time. For example, you might discover that most students are spending more time on Homework than you anticipated.
- Median time — Midpoint of time students spent in minutes.
- More details — Point on a dot for the number of students within a time range.
- Hide/show the chart — Select
 (top right) to hide the chart. To add it back, choose the chart name (top left) and select Add.
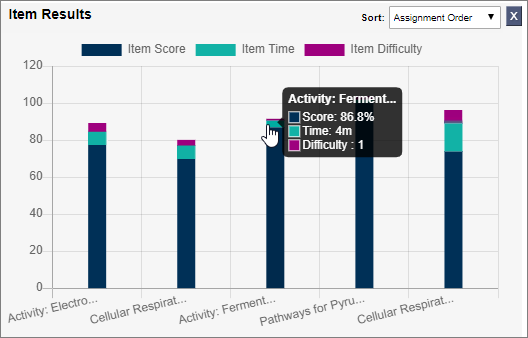
Use the Item Results chart to see the % score, time, and difficulty for each item in the assignment.
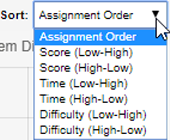
- Change the sort order — Select whether to order by assignment, score (low-high or high-low), time (low-high or high-low), or difficulty (low-high or high-low).
- More details — Point on an item bar to see its specific data.
- Fewer details Select Item Score, Item Time, or Item Difficulty to hide that particular data. The selected option appears with a strikethrough. To turn it back on, select the option again.
- Hide/show the chart — Select
 (top right) to hide the chart. To add it back, choose the chart name (top left) and select Add.
For a pooled assignment, the Diagnostics View reflects the fact that each student has been assigned only a subset of items from each pool in the assignment.
"Difficulty” is based on the number of correct and wrong answers submitted, as well as the number of hints requested.
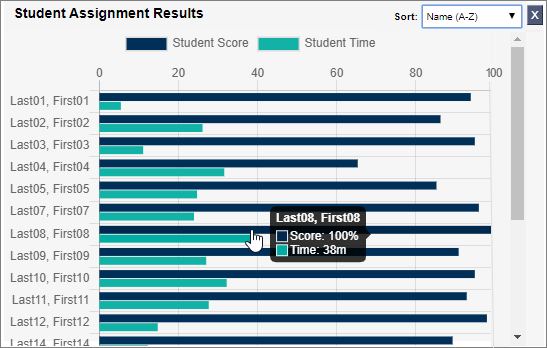
Use the Student Assignment Results chart to compare each student’s % score with the time spent.
It’s possible that students with a very high score but very low time may be cheating. (If you suspect this, see discourage student cheating by using Mastering features.).
- See all assignment scores for a student — Select a student name to open the Scores for student_name page.
- See a student’s work on the assignment — Select a student’s name to open the Scores page for that student. Select the score link for the applicable assignment to see the student’s work, including time spent, any wrong answers submitted, as well as any requested hints and hint answers
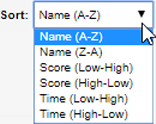
- Change the sort order — Select whether to sort by name (A-Z or Z-A), % score (low-high or high-low), or time (low-high or high-low).
- More details — Point on a student bar to see the % score and time data in minutes for the student.
- Fewer details — Select Student Score or Student Time to hide that particular data. The option appears with a strikethrough. To turn it back on, select the option again.
- Hide/show the chart — Select
 (top right) to hide the chart. To add it back, choose the chart name (top left) and select Add.
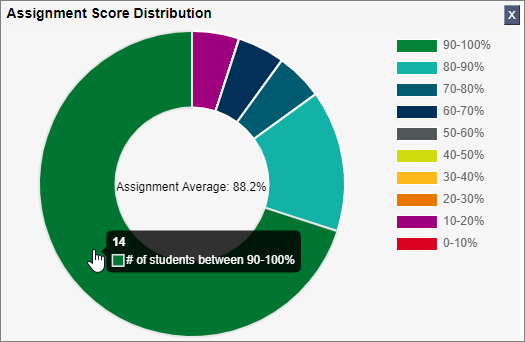
Use the Assignment Score Distribution chart to quickly see how your students did on the assignment. Chart data includes completed, incomplete, and unstarted work.
If most students did poorly, you may want to review the content in class, set up a Scheduled Reading assignment, or add an Adaptive Follow-Up for the assignment.
- More detail — Point to a segment to show how many students scored within the range.
- Hide/show the chart — Select
 (top right) to hide the chart. To add it back, choose the chart name (top left) and select Add.
Diagnostic charts are for an individual assignment. Here are some other ways to check class performance.
- Compare item statistics for your class with other students — See Class statistics by completed assignment items from the Overview page for each standard assignment.
- Diagnostics on ALL standard assignments in your course — Open the Gradebook to view statistics for all assignments. You can also export scores, times, and difficulty data from the Gradebook.
- Diagnostic data for specialized assignments — Diagnostic data is also available for specialized assignments, like reports for Dynamic Study Modules.