Format graph objects
Using the math grapher tools, you can shade areas in your graph and choose whether lines are solid or dashed. If you are plotting transformations, you can use sliders, text boxes, or checkboxes to transform the object.
To shade a region in your graph:
- Click the region shading tool
 .
. - Click inside the region you want to shade.
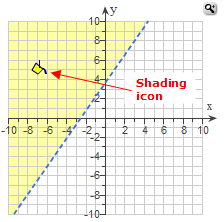
After you have shaded a region in your graph, you see the shading icon in the region.

To change a shaded region:
- Change the line, parabola, or circle that contains the shading. The shading will resize at the same time.
To delete shading:
- Click the shading icon inside the shaded region of your graph.
- On the large grapher, press Delete on your keyboard. On the small grapher, click Delete.
To change a line style:
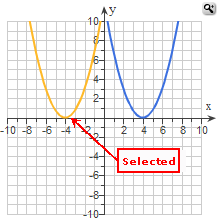
- Select the line. It turns orange when selected. For example:

- Click the appropriate section of the line style tool
 :
:
- To make a selected line solid, click the top section.
- To make a selected line dashed, click the bottom section.
When you are plotting a transformation of an x-squared, x-cubed, logarithmic, exponential, sine, or cosine function, you can use sliders, text boxes, or checkboxes to transform the object.
To transform the object, first select it. The sliders, text boxes, or checkboxes appropriate to the function appear next to the graph grid.
Then select the values using sliders. For example:


Or enter values in text boxes. For example:
