Use the grapher
You use the grapher to answer graphing questions when you do assignments and practice. The grapher gives you a grid where you plot your graphs and a palette of tools you can use to create different kinds of graphs.
When you first open a graphing question, you see a small version of the grapher.
You can work in the small version of the grapher, but the large version is easier to see and gives you hints to help you work.
Use the small grapher
To work in the small grapher, click on the graph grid to pop up a palette of drawing tools to use to plot your graph.
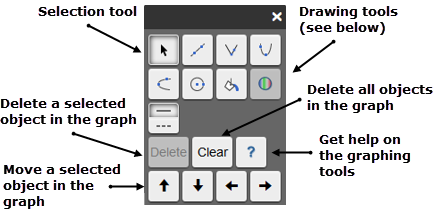
A floating tool palette appears next to your graph. You can move the floating tool palette to any convenient location within the question-and-answer area of the player:

Click the X in the top right to dismiss the tool palette.
Use the large grapher
To open the large version of the grapher, click the enlarge button  in the question or click the magnifying glass icon
 ![]() above the grapher.
above the grapher.
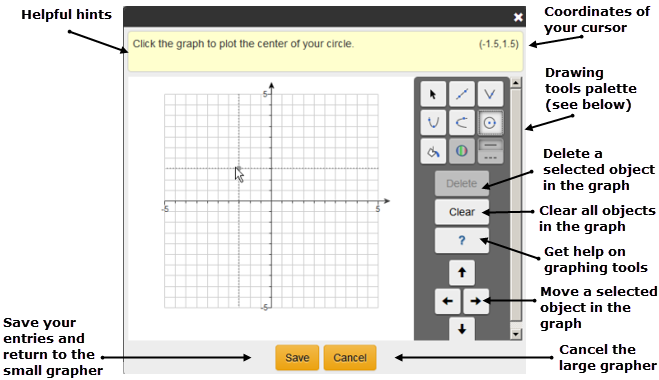
The following image explains the parts of the large grapher and the tools palette.


|
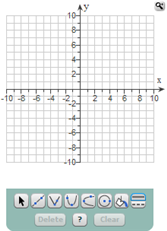
When your courses uses the older player on a PC or laptop, you see the small version of the grapher when you first open a graphing question. You use the tools at the bottom to graph your answer. You can work in the small version of the grapher, but the large version is easier to see. To open the large version of the grapher, click the enlarge button |
Use the large grapher
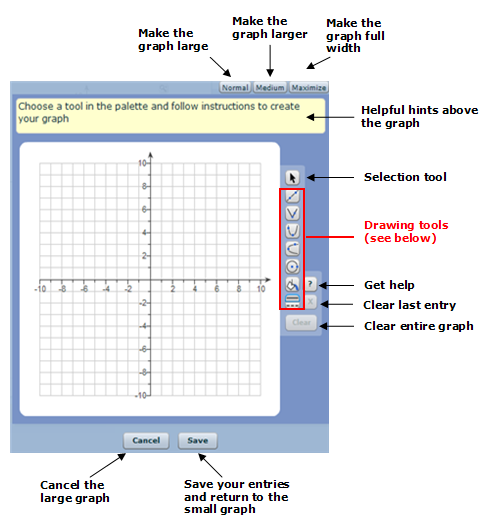
The following image explains the parts of the large grapher.

When you need to draw a graph to answer a question, you use the icons on the tool palette to select a tool.
To use the tool palette:
- Click on a drawing tool button to use that tool.
For example, click the line tool button
 to draw a line.
 - Inside the graph grid, hold down the mouse button to draw the object and release when you're finished. If you are using a touch-screen device, use your finger or a stylus to draw objects.
If the object has more than one point, click and release the mouse button or tap for each point.
When you click an object in the graph to select it, the object turns orange. Click outside the object to un-select it.
When you select a tool, you see instructions for using the tool. For example:

See Format graph objects for details on working with graphing tools to plot a graph.
The drawing tools available in the grapher depend on the type of graph you need to draw to answer the question. Click on a linked tool name to get more information on using the tool:
| Icon | Use |
|---|---|

|
The line tool - draw a line between two points |

|
The circle tool - draw a circle |

|
The vertical parabola tool - plot a vertical parabola |

|
The horizontal parabola tool - plot a horizontal parabola |

|
The absolute value tool - graph an absolute value function |

|
The 3-point quadratic tool - graph a 3-point quadratic function |

|
The 4-point cubic tool - graph a 4-point cubic function |

|
The x-squared tool - graph a basic x-squared function and transform it |

|
The x-cubed tool - graph a basic x-cubed function and transform it |

|
The logarithm tool - graph a basic logarithmic function and transform it |

|
The exponential tool - graph a basic exponential function and transform it |

|
The sine tool - graph a basic sine function and transform it |

|
The cosine tool - graph a basic cosine function and transform it |

|
The region shading tool - shade an area in your graph |

|
The solid/dashed line tool - make the line of a selected object either solid or dashed |