Enter answers in math courses
The math player is used for all online math courses.
You enter your answers in the work area in the math player.
You can enter answers in one of the following ways:
- Typing your answer in an empty box. For example:

You can use the math palette to enter special mathematical formats and symbols (for example, fractions and square roots). It contains templates that help you insert your answers. In most courses, the math palette appears when you click inside the answer box:


In the older version of the player, the math palette appears beside the question and looks similar to this example
For example, if you want to insert the mixed fraction 2 1/3 into your answer, you would click this template:

In the template in your answer, you would enter 2 in the box on the left, 1 in the top box on the right, and 3 in the bottom box on the right:

See Use the math palette for details on entering answers using the math palette.
You can also copy and paste using keyboard shortcuts. Select the text, and click Control-c to copy. Then click Control-v to paste.
You also can use keyboard shortcuts to enter math symbols and functions. See Use keyboard shortcuts for details.
- Selecting an answer from a multiple-choice list. For example:

- Plotting your answer on a number
line. Use your cursor to drag the arrow-shaped pointer to the correct
point on the line:

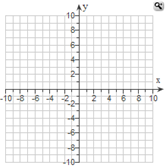
- Plotting the answer on a graph. If
your answer requires you to plot points on a graph, you see a blank graph.
For example:
Click the magnifying glass icon
 to make the graph larger.
Click a drawing tool icon to draw on the graph.
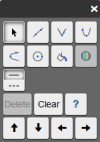
- In most courses, you can click on the graph to pop up the palette of graphing tools:
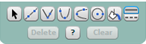
- In the older version of the player, the drawing tool icons appear at the bottom of the graph:
For example, to draw a dashed line, you would first choose the plot line icon
 and click the dashed line style
  .
. Then you would click the fill icon
 to shade the
lower region of the graph.
to shade the
lower region of the graph.For more information on using the graphing tool, see the grapher help.
- In most courses, you can click on the graph to pop up the palette of graphing tools:
In addition to the information in this documentation, you can view a tour on how to enter answers.
See Use the player with JAWS for details on using the JAWS screenreader with the player.
See also: